FortiMinute Tips: Changing default FortiLink interface settings

Welcome back to the ginger world of engineering, which has been quite a bit Forti-fied since last writing. A good bit of my $dayJob is spent enabling folks to get their FortiStuffs up and running, and it’s way past time to share some of that FortiGoodness here.

Kicking things off with a relatively simple tip, but one that FortiStarters don’t often know, changing the IP/netmask of the Switch Controller FortiLink Interface.

By default, the FortiLink interface comes with a perfectly functional 169.254.1.1/24 address and hands out DHCP addresses for switches in this scope. Perfectly functional, but non-routable ip addresses.

When you want to ping or monitor your switches individually by IP address with 3rd party tools, this non-routable ip scope becomes a no-go on accomplishing these particular tasks.

So before you start hooking up your FortiSwitches for discovery, go ahead and do your future self a favor and change the IP/Netmask to a routable IP address range, and feel free to adjust the DHCP range of your subnet if you don’t like the auto-filled in default range. Future self will thank you for your kindness*.

While you’re at it, treat yourself to a user friendly alias and a couple of interface members for redundancy. You work hard, you deserve it.

*If you decide you don’t want to trouble present self with this change, it is entirely possible to change this later with a little planning and some downtime. But, unless you and future self just love maintenance windows, why wait?

Published 09-29-2022 (screenshots featured in this post are from version 7.0.6)

Disclaimer: I am an employee of Fortinet at the time of this post, but this isn’t a corporate blog and shouldn’t be viewed as any kind of official Fortinet publication. As always, consult your SE/TAC/official documents before making any kind of changes to your network, I promise TAC will not be impressed with “@amyengineer said it was okay.” 😉

Taking control of the last-mile delivery

Managed network service providers (MNSPs) and their particular issues don’t generally keep me awake at night. But in a world of SD WAN disruption and its tendency towards less and less visibility for MNSPs due to more and more closed boxes littering the last mile landscape, those MNSP engineers aren’t getting a whole lot of sleep when it comes to dealing with last mile delivery issues.

Network insight has been all the rage over the last couple of years, but that telemetry is generally exclusive to the equipment owners – leaving MNSPs, who have no access to the hardware, in the dark. As this problem becomes increasing prevalent, many of the tools designed to shine light on this issue require expensive tooling and complex integrations.

Ixia’s newly announced IxProbe offers itself as an operationally simplistic approach to this visibility gap. In a small form factor that takes minutes to install inline, IxProbe provides traffic stats, link status, and when used in conjunction with Ixia’s Hawkeye, a battery of QoS and link quality tests.

Below are just a few features this test probe brings to the table.

    • Can be installed by non technical resources in the field
    • Both active and synthetic test capable
    • Adopts the IP address of the router (watch this video at the 7 min mark for a good discussion on how this works)
    • Fail-to-wire (if the device fails, your link doesn’t)
    • Only answers to your configured whitelist of management IP
    • APIs for network management system integration

IxProbe isn’t just for MNSPs, and it’s not just for inline testing. While you probably have a myriad of other monitoring solutions, networking probes, and QoS testing devices inside your own network, it’s worth noting that the IxProbe performs tests out of band and can easily be deployed throughout branch networks and other edge locations, perhaps as an option for unifying your test probe solution.

There is a 1 gig limitation on the device, though, so beware you won’t be using this to analyze performance on those big ole backbone links.

If you’re interested in more information on the IxProbe and how it fits into the rest of the Ixia testing and monitoring portfolio, be sure to check out both of these short TFD21 videos here.

You can also find the data sheet here: https://www.ixiacom.com/resources/ixprobe-active-sla-monitoring-service-providers-and-enterprises

Disclaimer: While Networking Field Day, which is sponsored by the companies that present, was very generous to invite me to the fantastic NFD21 event and I am very grateful for it, my opinions are totally my own, as all redheads are far too stubborn to have it any other way.

Published 10/26/2019

One API to rule them all, and in the ether(net) bind them

While some APIs are more open than others, and some APIs are better documented than others (god bless ’em), APIs prevail. From basic network infrastructure elements to all the complex applications flowing across them, just about everything we deal with today in IT has an API. Pretty sure even that new fridge @netmanchris bought has an API. 😉

The sheer quantity and diversity among these APIs presents network engineers, who are just starting to get a handle on automation, with the additional challenge of wrangling umpteen different versions of APIs into cohesive, scalable, and maintainable processes that don’t make them hate their lives on a daily basis.

So what better to way to corral your herd of APIs than with another API?  To quote @scottm32768 in this grand networking quest, “One API to rule them all, and in the ether(net) bind them.”

Or to put it another way:

As an orchestrator of orchestrators, that’s where Itential comes in.  Their architecture takes modern API and abstraction focused principles, and leverages them toward solving this problem of API overload. All while providing a platform which itself is API accessible and automation ready.

Using adapters that consume and abstract the various input APIs of your multi vendor network, Itential provides a platform that allows you to build for various systems all in one place.  Sounds suspiciously like that single pain, err pane, of glass we’ve all been promised for years. So what’s going on under the hood?

Itential’s adapters are reaching into disparate systems, consolidating the data, and then normalizing it into a JSON schema.  The broker layer above the adapter layer performs the real magic by transforming the desired state configuration changes you want into the what each system needs to be told to do to make it happen.

Need to change a VLAN across a multi vendor environment?  No problem.  Need to validate similar configuration elements across multiple systems, each with the data accessible in a different format? No problem. Use Itential’s Automation Studio and Configuration Manager to design your workflows and manage your configuration changes. Then let Itential’s broker layer translate, while its adapter layer makes it happen.

What if you’re further along than most in the automation game and are sitting on a repository of your own network automation scripts? One, you get a cookie. Two, Itential allows you to bring those into the platform as well using their Automation Gateway.

The Automation Gateway also serves in cases where the vendor of your choice isn’t on the adapter list yet, but you still want some level of centralized automation.

If this commander of API armies, this chieftain of your automation islands, peaks your interest, I recommend checking out Itential’s fantastic Networking Field Day 21 video here that details the platform architecture along with an excellent demo (demo starts at 14 min mark). Also, be sure to check out their developer tool website, which has lots of great links and FAQs, and their additional NFD21 videos as well.


Disclaimer: While Networking Field Day, which is sponsored by the companies that present, was very generous to invite me to the fantastic NFD21 event and I am very grateful for it, my opinions are totally my own, as all redheads are far too stubborn to have it any other way.

Published 10/20/2019


Network Change Validation Meets Supersized Network Emulation

Large scale networks means large scale configuration and change management testing. Or at least it should.

But device expense, power costs, and space limitations mean full scale physical network labs don’t happen. We, the engineers, get to roll-out complex network changes based on limited tests and what we hope is a well thought out, bulletproof rollback plan. We often risk significant loss of revenue for the company and significant loss of sleep for ourselves if changes go poorly.

This is not just a big shops problem either.  Even – or perhaps especially, small to medium enterprises lack full scale physical labs to simulate changes.  I’ve known one engineer that used to have a Nexus 5K on his desk (I’m looking at you @that1guy_15), but most of us are lucky to have a few pieces of equipment to cobble together to give us the general gist of the impact of a potential network change.

With the cloud eating everything, it’s about time that it started giving back to engineers – and that is what Tesuto seeks to do.  Tesuto leverages cloud to perform large scale emulation of networks, while allowing engineers to leverage modern automation tools and testing along the way.

Tesuto spins up emulation devices in Google Cloud or Digital Ocean, with support coming soon for Azure, AWS, and private cloud as well.  These spun-up devices have full L2 connectivity with each other and are running the actual vendor images, giving engineers emulations that can accurate reflect control plane functionality for configuration and change testing at the scale your network demands.

It’s worth noting that if you want to test ASIC specific functionality or throughput testing, this is not the platform for those types of tests. Emulations are ideal for control plane and connectivity testing, such as making BGP routing changes and seeing what neighbor relationships you hosed up, but not so ideal for how many packets per second a device can spit out.

So why not use GNS3, which offers device emulation as well?  Resource scale, ease of use, Rapid Initialization*, and the ability to tie into modern automation configuration and testing tools such as Ansible, NAPALM, etc…, are just a few reasons why cloudifying your network emulations with Tesuto starts to make sense.

Personally, I found the interface to be pretty intuitive, creating a few routers from different vendors, connecting them, and logging into the Tesuto provided jumpbox was quick and painless. Uploading licensed images for some vendors is required, so be prepared to BYOI (bring your own image).

The ability to run built in NAPALM validation tests takes a bit more finesse and experience, as does integrating Tesuto into your automated change management pipeline if you have one. With a bit of additional work, though, you can create your own validation tests, you are not limited to the built in tests or to NAPALM.

Tesuto brings a ton of additional features to network emulation, as you can see from the chart below. I recommend watching both NFD21 presentations, especially this demo in which a lot of questions you don’t even know you have yet are answered, and be sure to check out pricing information here for details on their pay as you go plan or monthly commit plan.

*Tesutos’s Rapid Initialization is a feature which significantly decreases boot time of the devices after first power on, so that MX router that takes 25 mins to boot the first time in an emulation takes only 5 mins on future boots. 


Disclaimer: While Networking Field Day, which is sponsored by the companies that present, was very generous to invite me to the fantastic NFD21 event and I am very grateful for it, my opinions are totally my own, as all redheads are far too stubborn to have it any other way.

Published 10/13/2019

Arrcus: An Application of Modern OEM Principles for Whitebox Switches

What’s a pirate’s favorite switching platform?

Arr-cus.  😂

And before I make a joke about networking ship-sets (too late), I’ll move onto what Arrcus is and why you should be checking them out!

Arrcus manufactures white box switches running ArcOS, their latest generation of switches leveraging the Jericho-2 chipset.

Touting a microservices architecture, multi-tenancy at scale, and open integration across multiple ODM vendors, ArcOS offers up a hardware agnostic platform that finds it home in data center fabrics, large scale peering/edge deployments, and cloud deployments.

With support for OpenConfig and YANG, Arrcus intends for users to leverage APIs for operations and management in modern fashion, no slumming it with old school CLI (although there is one should you choose to use it).

With claims of up to 100 million (that’s 100 meeeeellion) BGP paths and carrier grade class hardware, the OS also provides streamed telemetry data for multiple purposes, including monitoring device health and workload mobility. Arrcus also takes advantage of streaming telemetry in BGP route validation, comparing real time data with RPKI lookups and sending notifications to operators of potentially hijacked routes.

Support for BGP-LSVR is also part of the ArcOS platform. Which if you don’t live in carrier land, you might have just said “huh?” (because that’s what I said as well).  BGP-LSVR is a IETF draft standard for augmenting BGP with Shortest Path Dijkstra algorithm behavior in an attempt to handle massively scaled out data centers and sneak around IGP flooding scale limitations.  I know what you’re thinking:

But BGP-LSVR has the advantage of the underlay and overlay both being BGP, as well as improved convergence times. And possibly dinosaurs wreaking havoc on humanity, but we’ll save that for the sequel.

For more Arrcus goodness, I recommend watching the Network Field Day 21 Arrcus videos, especially the demo presentation below.  I’ve also included some handy dandy research links for both Arrcus and BGP-LSVR if you’d like to learn more about either or both!

Arrcus Switching and Routing Demos from Gestalt IT

Link State Vector Routing as the Transport Underlay, by Keyur Patel, Founder & CTO

PacketPushers Blog New Network OS From Startup Arrcus Targets Whitebox Switching And Routing

PacketPushers Priority Queue Episode 160

PacketPushers Heavy Networking Episode 471

Networking Startup Arrcus Raises $30M, Unveils Enhanced OS To Compete With Cisco, Arista

ArcRRâ„¢: The Arrcus Route Reflector

Arrcus Videos and Podcasts


Disclaimer: While Networking Field Day, which is sponsored by the companies that present, was very generous to invite me to the fantastic NFD21 event and I am very grateful for it, my opinions are totally my own, as all redheads are far too stubborn to have it any other way.

Published 10/07/2019

Cisco Live 2019 – A Whirlwind of Networking Goodness

Cisco Live 2019 came and went in a whirlwind of fantastic meetups, excellent sessions, and genuinely nerdy networking conversations.

Cisco Live session content was top notch. Jasper Bongertz’s Wireshark talk blew the audience away with useful packet capture and troubleshooting tips, and Denise Fishburne’s Network Detective presentation captivated the audience with methodical troubleshooting processes and issue isolation techniques. Both sessions are a must watch for network engineers. Seriously, you will thank me (send coffee) and more importantly you should definitely thank them for giving so much to the community!

Tech Field Day captured a ton of great content this year as well.  I especially recommend this NetBeez presentation highlighting the exciting ways their monitoring solution is fighting the good fight by helping to prove it’s not the network. Their new integration with Cat9K switches is also covered and definitely worth checking out.

This year also featured the distribution of Amy’s Army of Angry Routers. Angry routers were given, angry routers were received, and a new site header came to be.

Cisco Live 2019 was also especially memorable in the recognition that this very blog received! As Cisco 2018 IT Blog Award winner for Most Entertaining, yours truly had her big screen moment! I couldn’t be more thankful for each of you who took the time to vote! Thanks for reading along, laughing along, and sharing along with my adventures, snark, and bits of wisdom. You all rock, and obviously have the best taste.


And finally, my favorite part of every Cisco Live wrap up, the photo gallery! So many long time friends, so many new friends.  The networking community is genuinely the best and you all make it that way.

Published 06/23/2019

New codec on the block – recording failures and CUCM 11.x

The inspiration for this post comes from spending way too much time trying to solve an issue that would have taken only minutes had I been aware of the key information I’m generously bestowing upon my fine readers today.

The problem started with reports that just 8841 phones weren’t successfully recording. I happened to have a spare 8841 phone, so I set up a line, configured recording parameters, and began testing. Sure enough – the recording failed on the spare phone.  I also happened to have a 7942 phone, set up an extension and the recording worked just fine.  Note that I had previously examined the endpoint configurations like recording server profile, Built in Bridge enabled, recording calling search space, and recording server setup for the extension.

Thinking this might be related to a SIP versus SCCP issue, I employed the RTMT to see if the audio for the SIP calls was being forked and sent to the recording server. I was able to drill into the SIP call placed to the recording server, check out the Call Flow Diagram, and confirm the recording server was invited to the party.  If you’ve not done this before, just need to log into the RTMT and navigate to Real Time Monitoring Tool -> Voice/Video -> Session Trace Log View -> Real Time Data. While snooping around all the SIP calls to the recording server, I noticed some successes belonging to 8841 phones.  Intrigued that my problem might not be model dependent, I hopped over to the recording server to see which extensions on 8841 phones *did* record successfully.  Which is where things began to make even less sense – only intermittent failures on some 8841 phones in question, others never recorded at all.

Using my any-excuse-for-a-packet-capture philosophy, I setup two 8841 phone endpoints to allow spanning to PC port and fired up Wireshark.  My test recording failed, but my packet analysis hit pay dirt.  When filtering for RTP, I saw PT=OPUS in the Info column.  Immediately, I had my answer.

I was vaguely aware the Opus codec was a thing, but I previously had no idea that 8841 phones supported the OPUS codec and that CUCM 11.X enabled the OPUS codec automagically (thanks?) – all information I gleaned from this link.

Knowing that recording servers historically hate anything that isn’t g.711 or maybe g.729, I immediately proceeded to follow the instructions from the aforementioned link to find and disable Opus for recorded phones. I previously did this for g.722 many years ago, which is why this solution stung a little, my not being aware there was a new codec on the block and to have preemptively avoided this issue entirely.

from https://www.cisco.com/c/en/us/support/docs/unified-communications/unified-communications-manager-callmanager/200591-OPUS-Codec-Overview.html

While looking at the Opus parameter, I couldn’t help but notice iSAC was new to me as well.  Sifting through my packet captures, I found RTP streams using that codec as well and so disabled it for recorded phones, too.

Below are a couple of screen shots of what you can expect to see in the SIP/SDP packets if you are experiencing this same issue. Hopefully this saves you a bit of leg work should you have some recording failures after an 11.x upgrade.

Feel free to send thanks in the form of flowers, coffee, and cheesecake.

Published 10/18/2018

“Thirteen hundred APs, no open support tickets” – achieving quality in wireless networks

“Thirteen hundred APs, no open support tickets,” Sudheer Matta, VP of Products for Mist Systems, boldly stated during his MFD3 presentation.  At the time, he was referencing one of their largest customers specifically, but the company’s desire to prevent bugs, create high quality customer experiences, and resolve issues quickly were principles that permeated the discussions with Mobility Field Day delegates.

Mist leverages several key components in order to pull off their customer focused reliability, visibility, and proactive troubleshooting of the wireless network.

Cloud-based micro-services architecture.  This modern approach to building systems is part and parcel of what many cloud companies have been doing with their software architecture over the last few years.  Instantiating distributed services and leveraging APIs between these services is foundational to providing the kind of resiliency and redundancy cloud makes possible and Mist credits this architecture with how they are able to push out new features, fixes, and services weekly without causing any data plane outages for customers.

In his presentation, Sudheer shares an impressive case of how Mist was able to do a complete restore for a customer that had deleted their entire controller infrastructure. All the controllers and services were back online in less than 2 hrs with no access point reboots or data plane outages, a feat Sudheer also credits to Mist’s distributed architectural approach.

Analytics. These days collecting data is table stakes, the real advancement is in building better algorithms that provide useful information to customers. Mist calls these, “actionable insights” and they are more than just increasing the noise floor with more alerts. Mist believes their actionable insights are so dead on that they’ve announced proactive anomaly detection, meaning the system will open a ticket on your behalf when an issue is detected.

And the analytics don’t stop with just ticket opening – MARVIS (Mist’s AI) is getting several feature enhancements focused on improving the troubleshooting process, reducing analysis time, and improving RRM.

A culture of attention to detail. After watching Mist’s MDF3 presentations, I would describe their business model as “just good enough is not good enough for us.”

Besides a distributed architecture designed to minimized the number of bugs and the impact of those bugs that do make it into the system, issues are expected to be resolved quickly and not allowed to fester or be ignored.  A clear emphasis is placed on quality and usability of the system, from the architecture to the user experience.

Mist is also listening both to its customer base as well as wireless engineers. An improved adapter bracket, the transparency with firmware version issues, the coming soon red and green buttons, and the constant tuning of the virtual assistant were just a few indicators from the presentations that customer experience and usability not only matter, but are at the top of the priority list.

For more Mist goodness, be sure to check out these posts:

@badger-fi – Mom’s love Mist

@rowelldionicio – Demistifying Wi-Fi Issues

@Drew_CM – Mist Enhances Machine Learning Capabilities To Improve WLAN Performance, Troubleshooting

@theitrebel – MDF Day 1 Recap

Disclaimer: While Mobility Field Day, which is sponsored by the companies that present, was very generous to invite me to the fantastic MDF3 event and I am very grateful for it, my opinions are totally my own, as all redheads are far too stubborn to have it any other way.

Published 10/7/2018


Intro into Fortinet WLAN configuration

Simple, secure, sensible – Koroush Saraf, Fortiner VP of Product Management, emphasized these words in his recent MFD3 presentations. While any vendor can claim their products share these attributes, it’s usually the complexity of workflow that reveals the betrayal of one or all of these characteristics. Watching this Mobility Field Day demo, however, the simplicity of setting up a basic Fortinet WLAN SSID, applying security policies, and even setting up automation for quarantining an infected machine boiled down to just a few steps.

Step one:  Create your SSID.

In Fortinet world, creating an SSID creates a virtual interface.  At first, this seems like a strange construct to be involved in a WLAN setup process, but later in the process, the logic and flexibility of having this virtual interface becomes apparent.

To create your basic SSID, navigate to WiFi & Switch Controller, click on SSID, click Add New.  You can select if this SSID will be a Tunnel, Bridge, or Mesh SSID, as well as configure parameters such as IP address, DHCP server options, Default Gateway, DNS servers, etc…

Keep in mind that to avoid clutter, the GUI presents the essential and the most commonly used options for configuration. Some more advanced configuration may not be seen in the GUI but available via CLI.

Step 2: Attach or create an AP Profile.

The FortiAP Profile is where things like radio bands, transmit power, channel and channel width, etc… are configured and controlled in a manner that can be applied to multiple APs.

To create a new AP profile, navigate to WiFi & Switch Controller, and click on FortiAP Profiles, click Add New. 

To attach an already created AP Profile to an AP, navigate to WiFi & Switch Controller, click Managed FortiAPs, select your AP, and apply the appropriate profile to the AP. This screen is also where you would configure AP specific options that would not apply to all APs using the profile selected. 
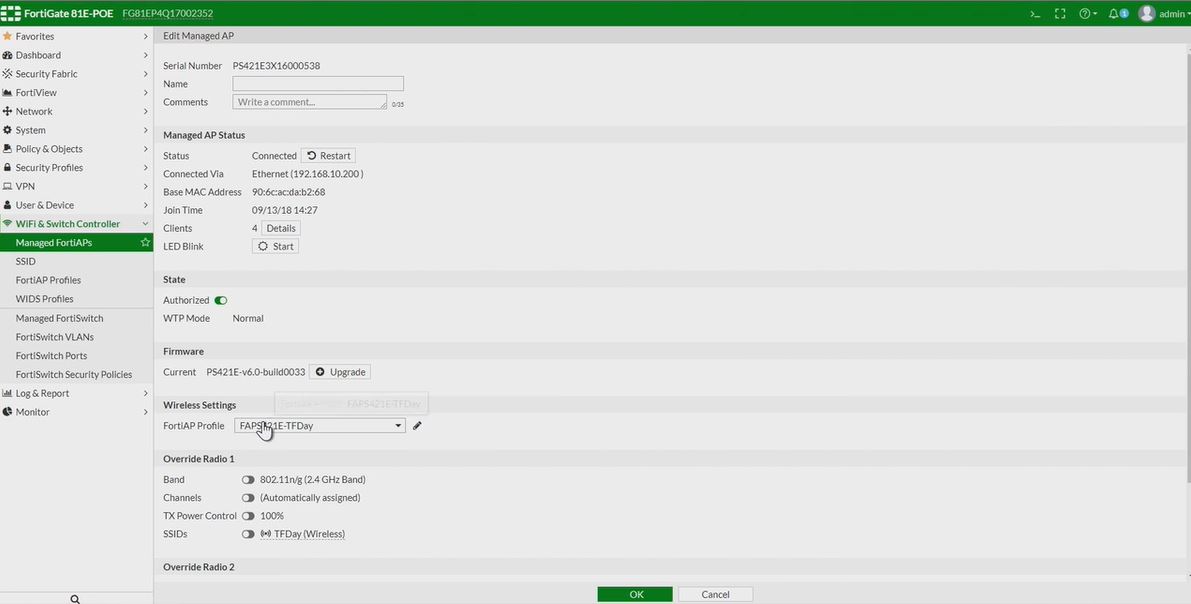
Note, this assumes you have already setup your basic controller parameters so that APs can be automatically discovered.  For more information, see the documentation cited at the end of this post.

Step 3: Create interface policies.

This step brings together the SSID virtual interface created and the security policies that need to be applied to the SSID.  The virtual interface allows for the straight-forward application of security policies such as allowed/denied ports and protocols, along with UTM features and application restrictions.

For engineers that have configured Fortigate firewalls, this part of the process will feel the most familiar since it’s leverages the same process of policy creation used to create traditional firewall rules. 

Bonus step: Configuring an automation alert for compromised clients.

Now that you have your SSID and AP online, you can head over to Automation and quickly setup workflow for what should happen when the Fortigate sees a compromised host. You can see from the screen shot below that not only can the host be quarantined automagically, but an email could be sent to inform those taking the calls from the angry virus-spreading-machine owners that these machines have been blocked.Note this type of automation can apply not just to WLAN clients, it is a feature that can be used globally for all detected endpoints.

To see this demo in action, check out this MFD presentation in which Fortinet makes a compelling case for the idea that the lives of IT engineers shouldn’t be made so difficult all the time. Now if only all IT vendors thought this way…

And for even more Forti-content, check out these posts from fellow delegates:

Lee BadmanClarity and Confusion- Fortinet and Arista at Mobility Field Day 3

Scott LesterForti What

Jim PalmerA Story of Three Companies


Note: This post is based on the basic setup and topolgy given in the video presentation, for more advanced configuration information, please check out Fortinet’s documentation that can be found here. Also, Fortinet has an pretty awesome demo site here which allows you to log in and look around in pretty much any Fortinet product you’d like to see.

Disclaimer: While Mobility Field Day, which is sponsored by the companies that present, was very generous to invite me to the fantastic MDF3 event and I am very grateful for it, my opinions are totally my own, as all redheads are far too stubborn to have it any other way.

Published 9/30/2018

Solving 802.11ad challenges

The 802.11ad (60GHz) market has been interesting to watch, especially now that products utilizing the technology are becoming more prevalent.  Vendors leveraging 802.11 in a frequency band whose propagation properties differ significantly from the traditional 802.11 bands of  2.4 and 5GHz mean new engineering challenges to overcome.

The AP-387 point to point unit announced by Aruba earlier this year seeks to address these challenges in a few interesting ways.  Rain fade is primary concern when working with high frequencies such as 60GHz.  In order to combat this, the AP-387 has two radios, a 60GHz and a 5GHz radio, with the unit aggregating the throughput of both radios.

Should a storm roll through, the unaffected 5GHz radio will sustain the link, and the access point’s programming will dynamically adjust the amount of traffic sent to the deteriorated 60GHz radio.   Additionally, the physical design of the AP includes a lip that acts as an umbrella, keeping sheets of rain from coating the 60GHz antenna.

387-picture

The other key and quite snazzy feature of this PTP unit is the self aligning properties of the 60GHz radio, and it’s ability to dynamically scan and realign the link after heavy winds or vibrations.  Inside the access point are two 60GHz antenna elements and a chipset that allows the radio to scan +/- 40 degrees horizontally and +/- 10 degrees vertically in order to acquire or realign the link.

With such a wide scanning angle and the ability to self acquire the link, the need for precision in line of sight deployments is severely lessened.  I love the way Eric Johnson (Director of Product Management for Aruba) put it in his Mobility Field Day 3 presentation, “only minutes to deploy and hold my beer.”

The AP-387 has an extremely narrow (10 degree) beam-width, meaning units could theoretically be placed ~5 meters apart and still use the same channel. PoE+ is recommended for the AP-387, but it will operate with the 60GHz radio backed off by 3 db if 802.3af is used.

It’s important to note that there is a 500 meter distance limitation with these units..The product development reasoning behind the distance limitation is due to size and cost considerations of the high gain antenna elements for the 60GHz radios.  The current unit is rather small in comparison to other 60GHz products in this space, as you can see from the picture below.

AP-387

If you are interested in learning more about this 802.11ad PTP solution, I highly recommend this post  by

Aruba Powering Next Gen Mobility with Eric Johnson and Onno Harms from Stephen Foskett on Vimeo.


Disclaimer: While Mobility Field Day, which is sponsored by the companies that present, was very generous to invite me to the fantastic MDF3 event and I am very grateful for it, my opinions are totally my own, as all redheads are far too stubborn to have it any other way.

Published 9/23/2018